UNIVERSITY OF PITTSBURGH SCHOOL OF HEALTH + REHABILITATION SCIENCES
OFFICE CHAIR PERFORMANCE
CHARACTERIZATION
JUNE 2025
FIRST INDEPENDENT UNIVERSITY TESTING QUANTIFIES INDUSTRY LEADING OFFICE CHAIRS ON AVERAGE PEAK PRESSURES
LOW PRESSURE INDEX
PEAK PRESSURE INDEX
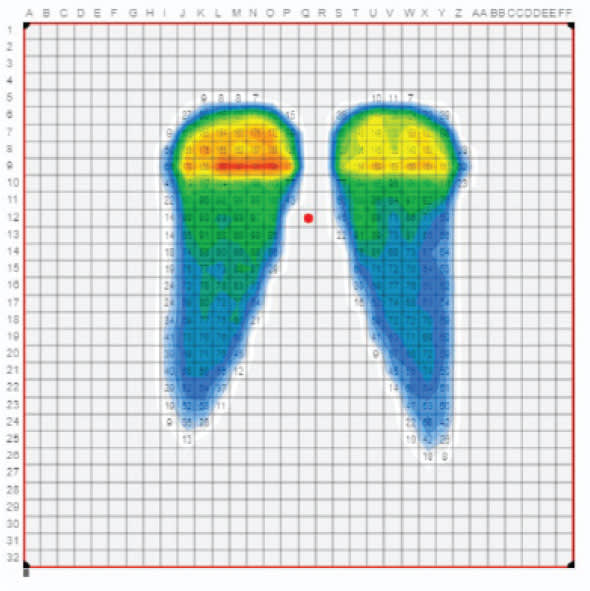
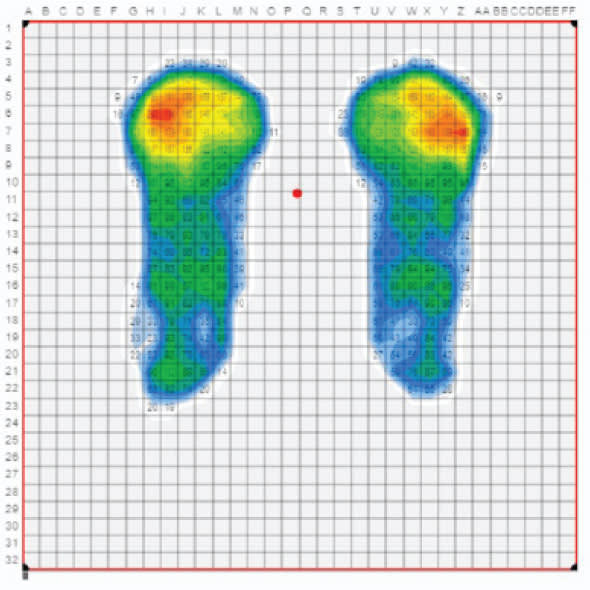
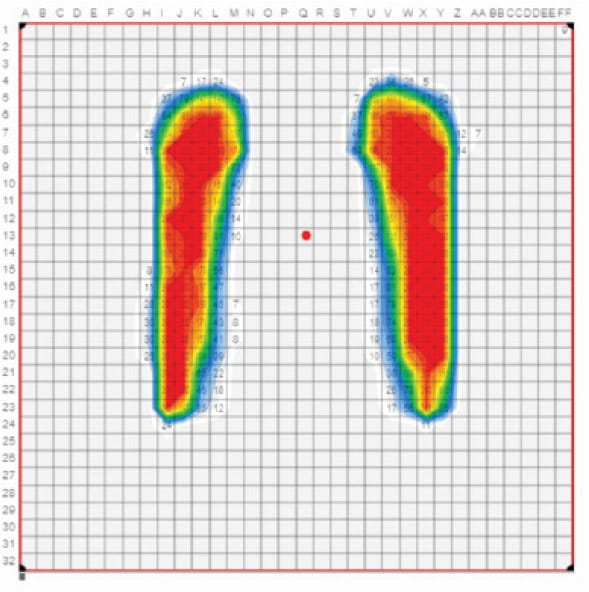
Peak pressure implies high pressures in one area. The peak pressure index is what is calculated by averaging the individual sensor results along the simulated IT (sit bones) portion of the testing fixture. Rather than simply taking the single highest value as the peak pressure, one random reading won’t skew the results or the perception of performance.
A high peak pressure index is associated with discomfort or pain, so low values are desired.
HIGH CONTACT AREA
CONTACT AREA
Contact area represents how much contact the indenter (or person)
is making with the seat surface. A higher contact area is desired as it implies greater pressure distribution and lower peak pressures.
LOW SHEAR
SHEAR
Shear is the combination of downward pressure (in sitting, through the buttocks), and horizontal friction (sliding forward in your seat when your skin sticks to the seat and you feel that pull). Imagine a child sliding down a metal slide wearing a bathing suit, with skin sticking to the slide all the way down; this is shear.
PRESSURE MAPPING
The University of Pittsburgh School of Health and Rehabilitation Sciences conducted standardized bench tests on 11 office chair seat cushions, recognizing that most people sit for 8+ hours a day. Because the average office worker isn’t typically at risk for tissue injury from sitting, the study focused on the most relevant comfort metric: peak pressure index.
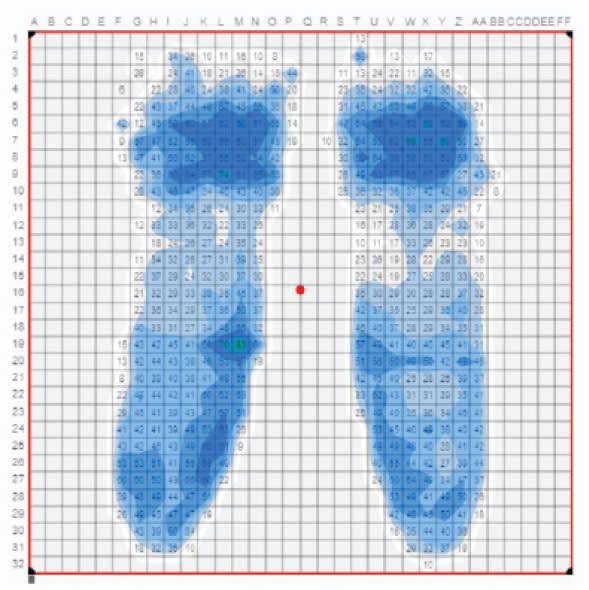
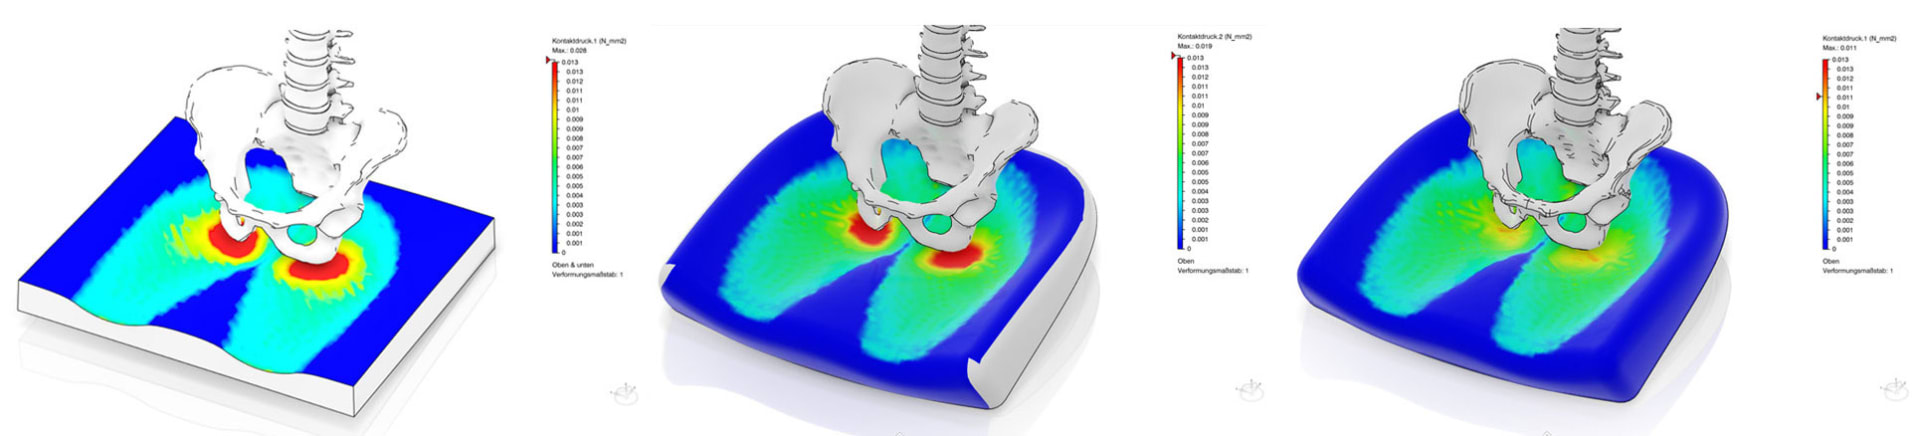 Examples of Pressure Map Readings
 ![]()
Biomechanical and tissue modeling performed by Simuserv integrated by Abaqus Unified FEA from Dassault Systèmes.
PRESSURE MAPPING ISO 16840-6
PEAK PRESSURE INDEX
Peak pressure refers to concentrated pressure in a specific area. The peak pressure index is calculated by averaging the sensor readings across the simulated ischial tuberosities (sit bones) on the testing fixture. This approach prevents a single outlier reading from distorting results or misleading performance evaluations. High peak pressure index values (shown in red) are linked to discomfort or pain, while lower values (shown in blue) indicate better pressure distribution and greater comfort.
*Performed on 4/5/25 at the University of Pittsburgh with a rigid load indenter. Human results may vary.
ANTHROS CHAIR
SECRETLAB TITAN™
HERMAN MILLER® EMBODY
HERMAN MILLER® AERON
Peak Pressure Index
Low Values are Desirable
LESS
0 mmHg
MORE
200 mmHg
i Limitations of Rigid Load Indenter Testing
Rigid load testing helps us see how a chair cushion responds to pressure in a very consistent and repeatable way. But since it uses a fixed device instead of a real person, it can’t capture how our bodies naturally move, shift posture, or redistribute pressure over time. It also doesn’t factor in things like muscle activity, body heat, or personal differences in soft tissue. So while this type of testing gives us helpful mechanical data, it doesn’t tell the full story. That’s why it’s important to also test with real people to truly understand comfort and support.
*Performed on 4/5/25 at the University of Pittsburgh with a rigid load indenter. Human results may vary.